Manage Energy, Not Time
“I just found a critical bug … sorry, the launch will be delayed again.” Does it sound familiar?
We have all relied on time tracking to hit a live date. Time can be easily measured and assigned to project milestones, but understanding human behavior is essential.
To think about projects in terms of behavior, consider the following:
- how your team interacts with one another
- how your team interacts with stakeholders
- is the intent of your project understood and supported
- are roles and responsibilities respected
- is the development pace sustainable?
Elastic Tribe prioritizes behavior over time because people drive projects.
It can be challenging to manage behavior because of unpredictability and difficulty to measure. Remember that team performance can be derailed by an unforeseen communication breakdown.
What drives behavior? Energy.
There are two components to energy: yours and the team’s. Both require attention for great things to happen.
Here are some examples of how I manage energy:
- Every morning I write my top 3 themes for the day
A simple habit to manage my own energy versus being managed by others - Short breaks throughout the day
Mental clarity is essential to remain motivated - Practice strategic versus tactical thinking
Finding problems adds more value that solving problems
“Think about projects in terms of interactions, not tasks or features”
Twitter this!
How do you manage your energy?
Learning how to track team energy has been challenging. Sometimes a project duration is short, team composition is hybrid (permanent and contractors), or personalities do not blend enough.
Over the years I have used common sense, observed team behaviors, read great books (e.g. Drive by Daniel H. Pink) and received great advice from project managers. For example, some teams lack a clear business purpose or have long forgotten the why. If the why is unclear from day 1, executing the what and the how will be challenging.
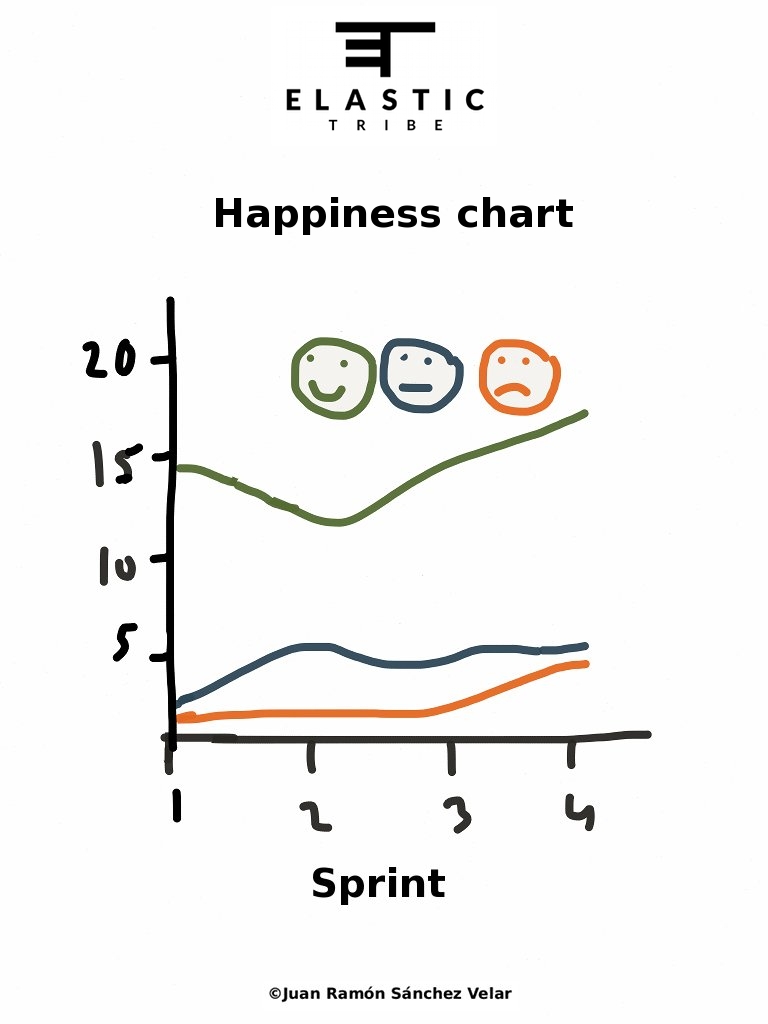
A team energy visualization I have found invaluable is a happiness chart. It brings visibility into the how (behavior) although typically businesses focus on the what (features). A happiness chart can show why a highly productive team decreases in productivity. It can also illustrate when a team has transitioned between growth phases (e.g. from storming to norming).
A happiness chart is based on a number of questions formulated with the team at the start of a project. For example:
- I am enthusiastic about working with my team
- My work in the project has meaning and purpose
- I am proud of the project and my work
- I find the project challenges my skill set
- In my team I feel bursting with energy
- In my team I feel there is a strong cohesion
- In my team I can quickly recover from setbacks
- In my team I can keep working for a long time
Before the end of a Sprint, team members select only one emoticon per question. The chart displays the total number of selections per emoticon. The Sprint report includes the chart to showcase full project visibility.
How do you manage team energy?


